Table 2. Mean ∆pHi/min in 0-Na+ in various experimental groups. *The ordering of the experimental groups are based on how they appear in the text. **P values were attained through ANOVA and adjusted with Tukey's Multiple Comparisons Test
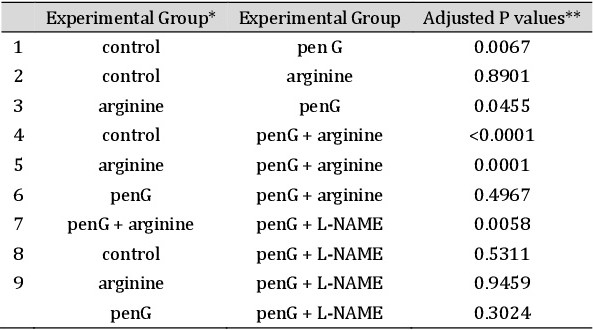
Table 2. Mean ∆pHi/min in 0-Na+ in various experimental groups. *The ordering of the experimental groups are based on how they appear in the text. **P values were attained through ANOVA and adjusted with Tukey's Multiple Comparisons Test